Introduction
Let's face it. We don't always write the most efficient queries, and once the queries get complex, it's not easy to see where/what in the query the performance issue lies and how to optimize the query. So it's very helpful to know some tools that makes the optimization easier. In this article, I'll give a quick walkthrough of how to utilize these tools.
Explain plan
PostgreSQL has this built-in functionality that outputs the execution plan of a query. You can simply run the following query:
EXPLAIN ANALYZE
SELECT *
FROM app.book
  INNER JOIN app.member ON book.owner_id = member.member_id
And the output you get will be like this:
Merge Join  (cost=4080.36..7432.21 rows=13435 width=737) (actual time=23.807..62.656 rows=13187 loops=1)
  Merge Cond: (member.member_id = title.owner_id)
  ->  Index Scan using member_pkey on member  (cost=0.29..3016.02 rows=40532 width=332) (actual time=0.009..22.021 rows=40561 loops=1)
  ->  Materialize  (cost=4080.07..4147.24 rows=13435 width=405) (actual time=23.787..29.080 rows=13187 loops=1)
        ->  Sort  (cost=4080.07..4113.66 rows=13435 width=405) (actual time=23.784..26.405 rows=13187 loops=1)
              Sort Key: title.owner_id
              Sort Method: external merge  Disk: 3632kB
              ->  Seq Scan on title  (cost=0.00..677.35 rows=13435 width=405) (actual time=0.008..5.588 rows=13187 loops=1)
Planning Time: 0.282 ms
Execution Time: 64.593 ms
This is basically a tree expressed in text format. its manageable, but not the easiest thing to read. So what I like to use is some visualization tools that convert it to a tree graph.
Visualization tools
Here are two nice visualization tools I use.
To use them, you will need to use a slight different query to output the execution plan in JSON format:
EXPLAIN (ANALYZE, COSTS, VERBOSE, BUFFERS, FORMAT JSON)
SELECT *
FROM app.book
         INNER JOIN app.member ON book.owner_id = member.member_id
This will give you an output like this:
[
  {
    "Plan": {
      "Node Type": "Merge Join",
      "Parallel Aware": false,
      "Join Type": "Inner",
      "Startup Cost": 4080.36,
      "Total Cost": 7432.21,
      "Plan Rows": 13435,
      "Plan Width": 737,
      "Actual Startup Time": 36.836,
      "Actual Total Time": 103.376,
      "Actual Rows": 13187,
      "Actual Loops": 1,
      "Output": ["title.title_id", "title.owner_id", "title.author", "title.genre", "title.display_name", "title.original_name", "title.logline", "title.cover", "title.illustrator", "title.is_visible", "title.is_r_rated", "title.is_serialized", "title.tag", "title.created_at", "title.updated_at", "title.deleted_at", "title.is_contracted", "title.is_translatable", "member.member_id", "member.ktw_id", "member.display_name", "member.email", "member.introduction", "member.avatar", "member.is_verified", "member.notified_by", "member.privilege", "member.created_at", "member.updated_at", "member.deleted_at", "member.latest_status", "member.agreed_terms"],
      "Inner Unique": false,
      "Merge Cond": "(member.member_id = title.owner_id)",
      "Shared Hit Blocks": 11560,
      "Shared Read Blocks": 0,
      "Shared Dirtied Blocks": 0,
      "Shared Written Blocks": 0,
      "Local Hit Blocks": 0,
      "Local Read Blocks": 0,
      "Local Dirtied Blocks": 0,
      "Local Written Blocks": 0,
      "Temp Read Blocks": 454,
      "Temp Written Blocks": 455,
      "I/O Read Time": 0.000,
      "I/O Write Time": 0.000,
      "Plans": [
        {
          "Node Type": "Index Scan",
          "Parent Relationship": "Outer",
          "Parallel Aware": false,
          "Scan Direction": "Forward",
          "Index Name": "member_pkey",
          "Relation Name": "member",
          "Schema": "app",
          "Alias": "member",
          "Startup Cost": 0.29,
          "Total Cost": 3016.02,
          "Plan Rows": 40532,
          "Plan Width": 332,
          "Actual Startup Time": 0.007,
          "Actual Total Time": 37.628,
          "Actual Rows": 40561,
          "Actual Loops": 1,
          "Output": ["member.member_id", "member.ktw_id", "member.display_name", "member.email", "member.introduction", "member.avatar", "member.is_verified", "member.notified_by", "member.privilege", "member.created_at", "member.updated_at", "member.deleted_at", "member.latest_status", "member.agreed_terms"],
          "Shared Hit Blocks": 11017,
          "Shared Read Blocks": 0,
          "Shared Dirtied Blocks": 0,
          "Shared Written Blocks": 0,
          "Local Hit Blocks": 0,
          "Local Read Blocks": 0,
          "Local Dirtied Blocks": 0,
          "Local Written Blocks": 0,
          "Temp Read Blocks": 0,
          "Temp Written Blocks": 0,
          "I/O Read Time": 0.000,
          "I/O Write Time": 0.000
        },
        {
          "Node Type": "Materialize",
          "Parent Relationship": "Inner",
          "Parallel Aware": false,
          "Startup Cost": 4080.07,
          "Total Cost": 4147.24,
          "Plan Rows": 13435,
          "Plan Width": 405,
          "Actual Startup Time": 36.819,
          "Actual Total Time": 46.070,
          "Actual Rows": 13187,
          "Actual Loops": 1,
          "Output": ["title.title_id", "title.owner_id", "title.author", "title.genre", "title.display_name", "title.original_name", "title.logline", "title.cover", "title.illustrator", "title.is_visible", "title.is_r_rated", "title.is_serialized", "title.tag", "title.created_at", "title.updated_at", "title.deleted_at", "title.is_contracted", "title.is_translatable"],
          "Shared Hit Blocks": 543,
          "Shared Read Blocks": 0,
          "Shared Dirtied Blocks": 0,
          "Shared Written Blocks": 0,
          "Local Hit Blocks": 0,
          "Local Read Blocks": 0,
          "Local Dirtied Blocks": 0,
          "Local Written Blocks": 0,
          "Temp Read Blocks": 454,
          "Temp Written Blocks": 455,
          "I/O Read Time": 0.000,
          "I/O Write Time": 0.000,
          "Plans": [
            {
              "Node Type": "Sort",
              "Parent Relationship": "Outer",
              "Parallel Aware": false,
              "Startup Cost": 4080.07,
              "Total Cost": 4113.66,
              "Plan Rows": 13435,
              "Plan Width": 405,
              "Actual Startup Time": 36.815,
              "Actual Total Time": 41.379,
              "Actual Rows": 13187,
              "Actual Loops": 1,
              "Output": ["title.title_id", "title.owner_id", "title.author", "title.genre", "title.display_name", "title.original_name", "title.logline", "title.cover", "title.illustrator", "title.is_visible", "title.is_r_rated", "title.is_serialized", "title.tag", "title.created_at", "title.updated_at", "title.deleted_at", "title.is_contracted", "title.is_translatable"],
              "Sort Key": ["title.owner_id"],
              "Sort Method": "external merge",
              "Sort Space Used": 3632,
              "Sort Space Type": "Disk",
              "Shared Hit Blocks": 543,
              "Shared Read Blocks": 0,
              "Shared Dirtied Blocks": 0,
              "Shared Written Blocks": 0,
              "Local Hit Blocks": 0,
              "Local Read Blocks": 0,
              "Local Dirtied Blocks": 0,
              "Local Written Blocks": 0,
              "Temp Read Blocks": 454,
              "Temp Written Blocks": 455,
              "I/O Read Time": 0.000,
              "I/O Write Time": 0.000,
              "Plans": [
                {
                  "Node Type": "Seq Scan",
                  "Parent Relationship": "Outer",
                  "Parallel Aware": false,
                  "Relation Name": "title",
                  "Schema": "app",
                  "Alias": "title",
                  "Startup Cost": 0.00,
                  "Total Cost": 677.35,
                  "Plan Rows": 13435,
                  "Plan Width": 405,
                  "Actual Startup Time": 0.008,
                  "Actual Total Time": 8.646,
                  "Actual Rows": 13187,
                  "Actual Loops": 1,
                  "Output": ["title.title_id", "title.owner_id", "title.author", "title.genre", "title.display_name", "title.original_name", "title.logline", "title.cover", "title.illustrator", "title.is_visible", "title.is_r_rated", "title.is_serialized", "title.tag", "title.created_at", "title.updated_at", "title.deleted_at", "title.is_contracted", "title.is_translatable"],
                  "Shared Hit Blocks": 543,
                  "Shared Read Blocks": 0,
                  "Shared Dirtied Blocks": 0,
                  "Shared Written Blocks": 0,
                  "Local Hit Blocks": 0,
                  "Local Read Blocks": 0,
                  "Local Dirtied Blocks": 0,
                  "Local Written Blocks": 0,
                  "Temp Read Blocks": 0,
                  "Temp Written Blocks": 0,
                  "I/O Read Time": 0.000,
                  "I/O Write Time": 0.000
                }
              ]
            }
          ]
        }
      ]
    },
    "Planning": {
      "Shared Hit Blocks": 8,
      "Shared Read Blocks": 0,
      "Shared Dirtied Blocks": 0,
      "Shared Written Blocks": 0,
      "Local Hit Blocks": 0,
      "Local Read Blocks": 0,
      "Local Dirtied Blocks": 0,
      "Local Written Blocks": 0,
      "Temp Read Blocks": 0,
      "Temp Written Blocks": 0,
      "I/O Read Time": 0.000,
      "I/O Write Time": 0.000
    },
    "Planning Time": 0.248,
    "Triggers": [
    ],
    "Execution Time": 107.872
  }
]
It's quite a lot longer! Now copy-paste the output into a visualization tool to get the graph:
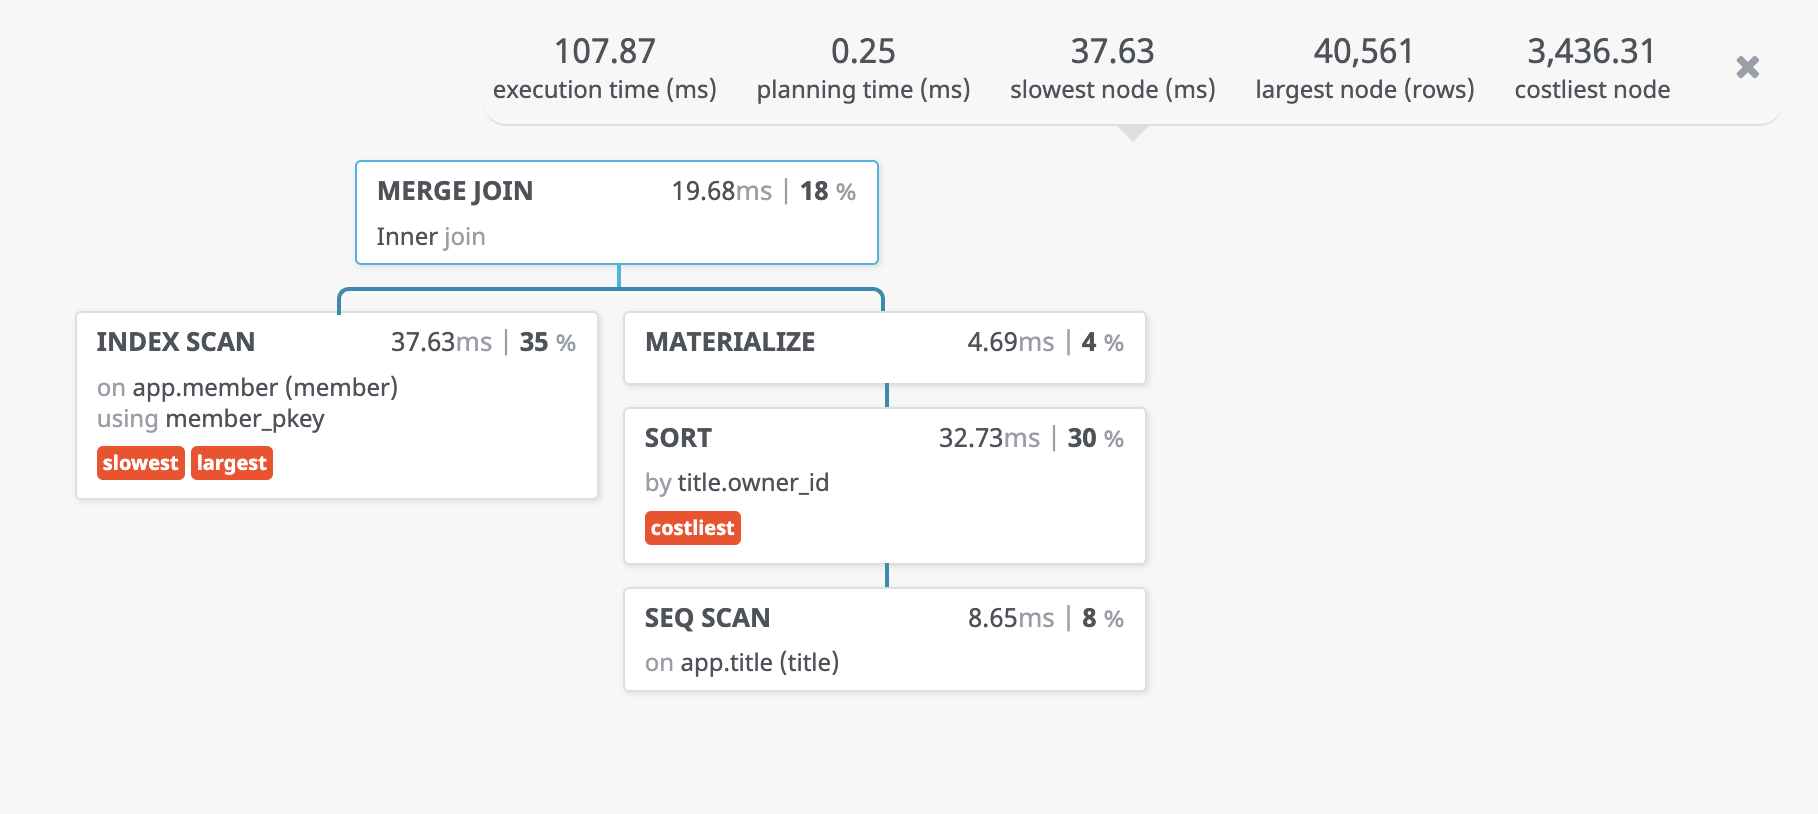
A lot easier to read, isn't it? This helps me quickly pinpoint where the performance bottleneck is. Hope you find it helpful too.